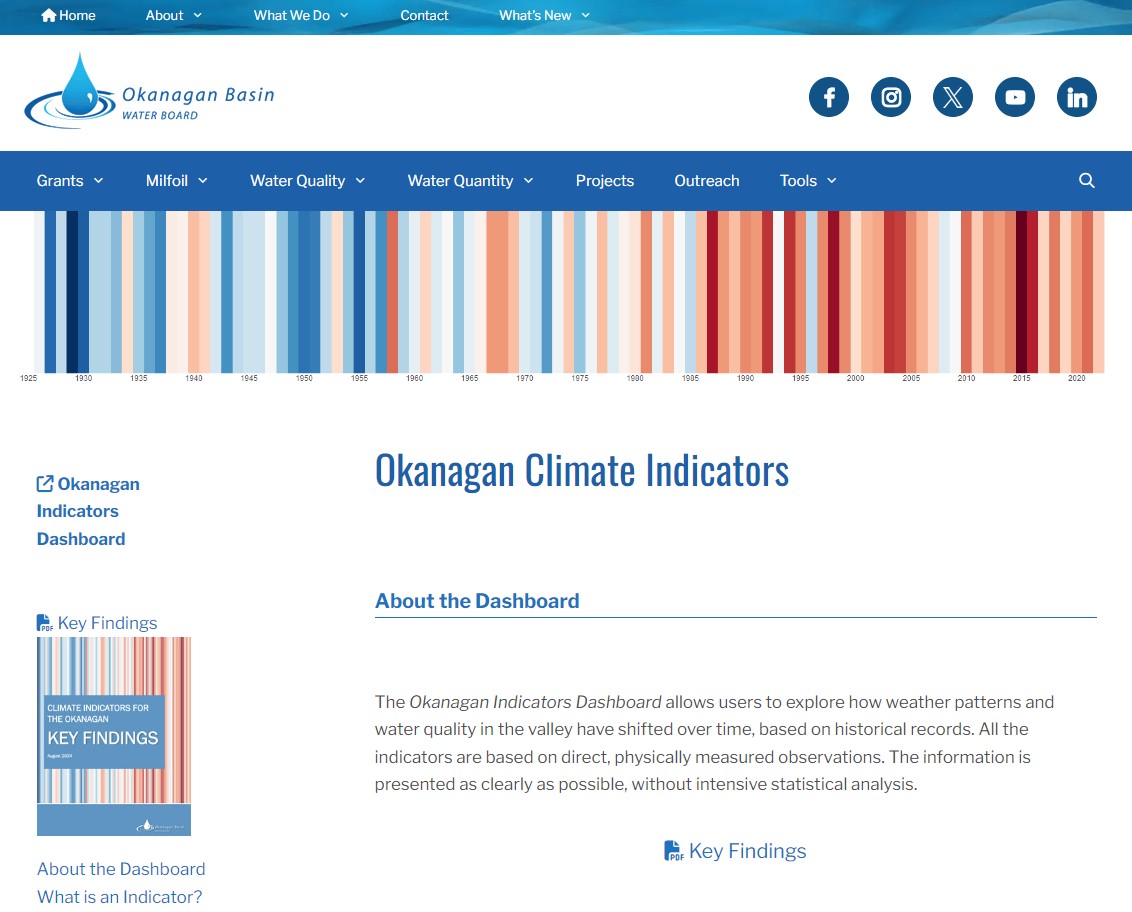
The Okanagan Basin Water Board has developed a new tool to help track climate change in the valley. The new “Okanagan Climate Indicators Dashboard” was launched this week and shows what the valley has been experiencing in the last 100 years with temperatures, precipitation types and patterns, streamflows and lake inflows. Its intention is to inform local policymakers and residents about these changes, and encourage people to take the necessary steps to help ensure a more climate-resilient and sustainable region.
Okanagan Water Board launches online tool to track climate history

In demonstrating the dashboard to local elected officials and media yesterday, project lead Sandra Schira pointed out “We see a really consistent shift in the last 30 years to a warmer and drier climate.” Variability between hot and cold, and wet and dry seasons, still exists, the OBWB water science specialist added, “but it’s a lot less and the patterns are quite clear.”
Understanding the implications of the Okanagan’s changing climate is important, OBWB Executive Director Anna Warwick Sears stressed. Knowing that we are beginning to see less snowpack in winter and an earlier melt in spring can help water utilities manage their supply to ensure there is enough to meet the needs of agriculture, domestic needs, and just as importantly, ecosystem needs. “If you are managing reservoirs and releasing water, the more you know, the better you can prepare. When it’s hot and dry, everything needs more water – right when we have less of it.”
OBWB Chair Blair Ireland noted that having this information can help farmers prepare for crops that will work with warmer and longer growing seasons. Local governments can plan for warmer communities by planting trees to provide shade, and creating cooling centres for the vulnerable. “This is pure weather data, but it’s very clear what we’re seeing,” he added.
“I know this subject can sometimes feel big and scary, but there is a lot of progress and inspiring projects that are happening,” Schira concluded. “The important thing is to tackle the parts that you really care about.” If you’re a gardener, think about how you can address some of these issues in how you garden. If you’re a teacher, find resources to talk with and help students act on solutions. “Many people are working on this and by working together we can address these challenges.”
The dashboard website lists resources for residents, educators, and local governments to prepare for our changing climate.
Find more information on this project and a link to the dashboard at https://OBWB.ca/indicators/.
For a demonstration of the dashboard, visit https://youtu.be/sle4qrZ35AQ.